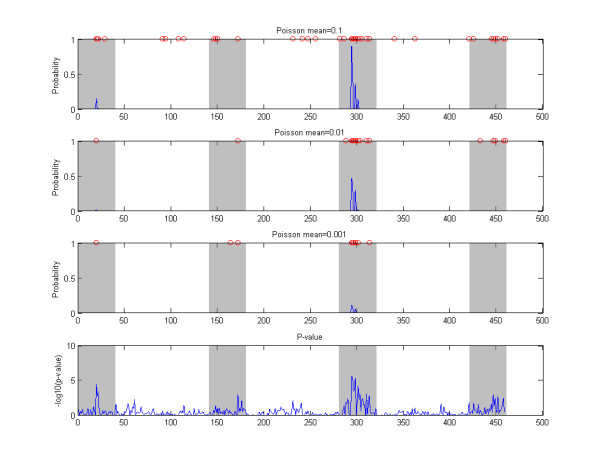
Figure 9.

Example, Bayesian graphical models. The top three panels show marginal probabilities of association obtained by a Bayesian graphical model analysis (see text). The results are shown for a single example data set generated according to the threshold model with GRR = 1.6 and MAF = 0.2. The results are obtained by using three different mean paramater values for the Poisson prior distribution and the values used are shown in the labels of the panels. The SNPs with non-zero probabilities are further highlighted by red circles on top of each of the panels. Disease associated genomic areas are indicated with gray background. The lowest panel shows the marginal p-values for reference.
