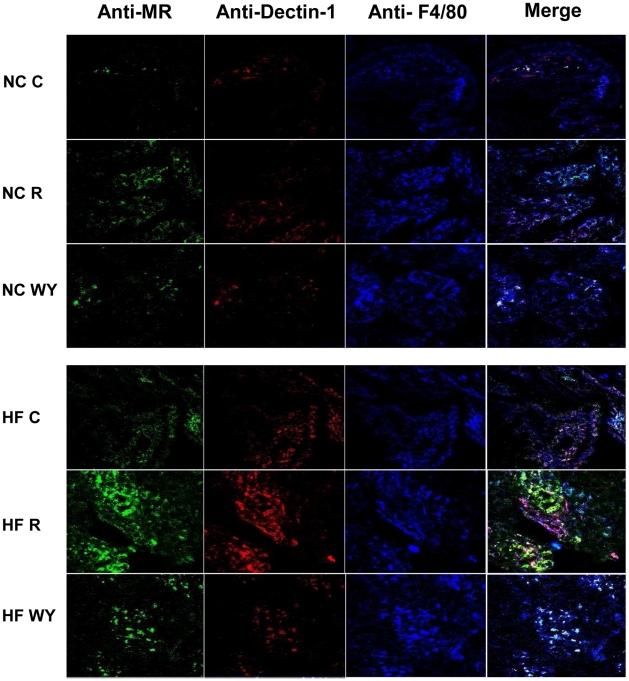
Figure 4. HFD and rosiglitazone treatment trigger recruitment to the cecal tissue of M2 macrophages that over express the MR and Dectin-1.
Confocal laser microscopy of cecum tissues from untreated (C), rosiglitazone (R) or WY14643 treated chow (NC) or HF fed mice. The blue color represents the macrophages; red represents Dectin-1 positive cells; green represents MR positive cells. Merged picture of green, red and blue colors represents triple positive cells. Staining is representative of at least three different cecal tissue samples of three animals by group.

