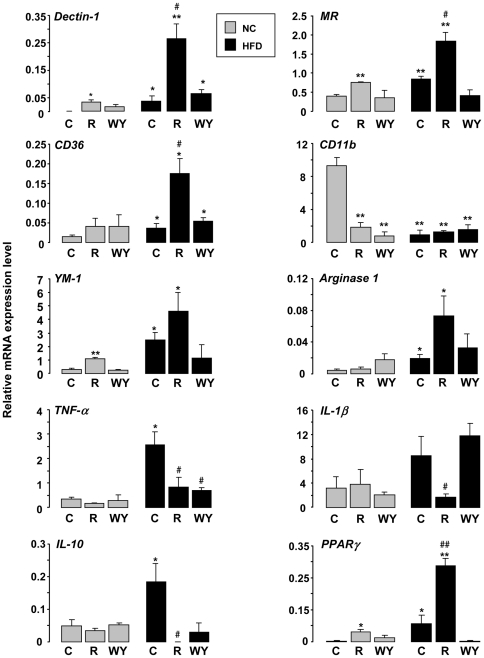
Figure 5. The cell types present in the cecal tissue from HFD mice exhibit a M2b phenotype which is shifted by rosiglitazone towards M2a.
Dectin-1, MR, CD36, CD11b, YM-1, Arginase 1, TNF-α, IL-1β, IL-10 and PPARγ mRNA expressions on cecal tissue from mice fed a chow (NC) or a HFD (HF) and treated or not (C) with rosiglitazone (R) or WY14643 (WY) evaluated by RT-PCR (n = 6). Data are represented as mean ± SEM *p<0.05 and **p<0.01 compared to NC control (NC C); #p<0.05 compared to HF control (HF C). The data are representative of three independent experiments.

