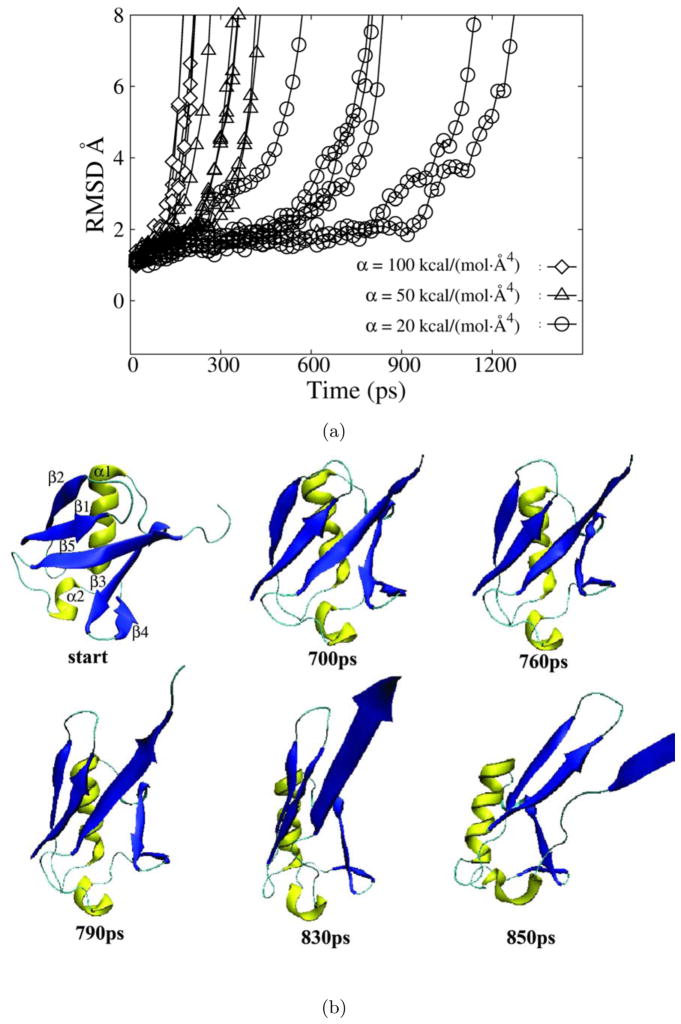
Figure 5.
HQBM simulations of ubiquitin. a) The RMSD of the ubquitin backbone atoms as a function of time for simulations in which bias potentials with a force constant α of 20 kcal / (mol ·Å4) (circles), 50 kcal / (mol ·Å4) (triangles) and 100 kcal / (mol ·Å4) (diamonds) was applied. b) Snapshots taken at the indicated time points during a HQBM trajectory in which a bias potential with a force constant of 20 kcal / (mol ·Å4) was applied. α helices are shown in yellow and β strands are shown in blue. For clarity, some C-terminal residues were omitted from partially unfolded structures.

