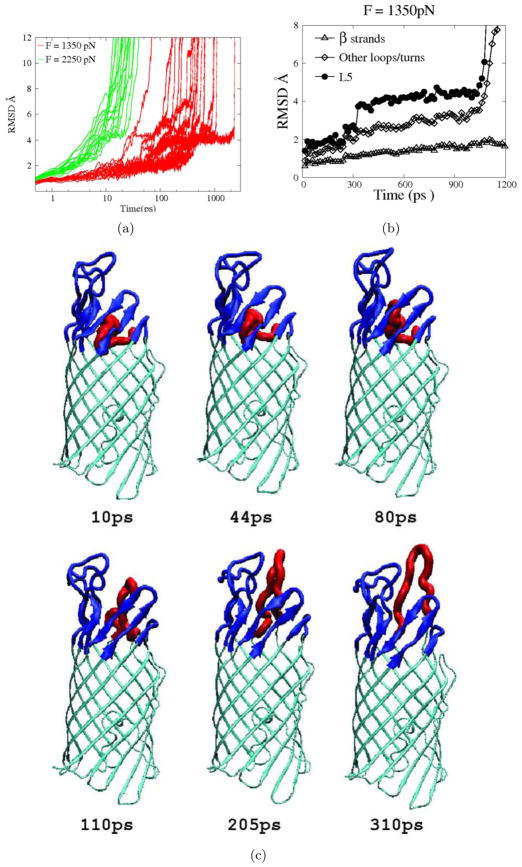
Figure 6.
Pulling simulations of EspP β domain with upward pulling forces applied to the tip of L5 (residues 222–224). a)The RMSD of EspP L5 backbone atoms as a function of time for simulations conducted with a pulling force of 1350 pN (red lines) or 2250 pN (green lines). The time axis is shown in log scale. The dashed square highlights a shoulder region of the RMSD curves corresponding to structures of an ensemble of stable intermediates. b) The RMSD of backbone atoms of various parts of EspP β domain (L5: filled circles; β strands: triangles; other loops/turns: diamonds) in a simulation trajectory employing a pulling force of 1350 pN. c)Snapshots taken at the indicated time points from a typical trajectory in which a pulling force of 1350 pN was applied. L5 is shown red, constraining loops/strands are shown in blue and other residues are shown in cyan.

