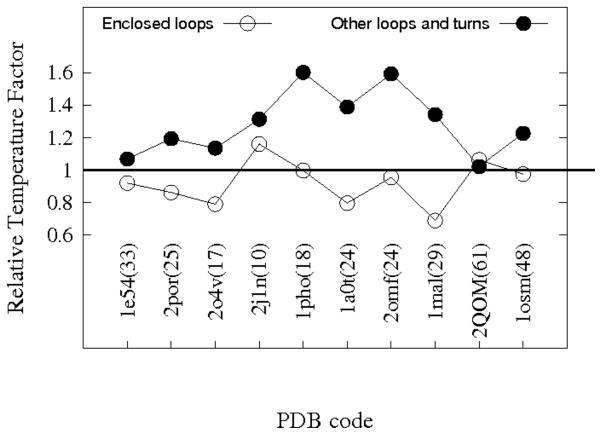
Figure 8.
The relative temperature factors of enclosed loop residues and exposed loop/turn residues for various MEBBs. The PDB codes are shown for each protein and the numbers inside parentheses besides each PDB code are the average B factors for the β strand residues of that protein. The vertical axis shows the average B factors of enclosed loop residues (open circles) and other loops/turns residues (filled circles) divided by the average B factors of β strand residues. The proteins analyzed were: Anion-selective porin from Comamonas acidovorans(1e54); Porin from Rhodobacter capsulatus(2por); Phosphate specific porin from Pseudomonas aeruginosa(2o4v); Osmotic porin from E.coli(2j1n); Phosphoporin from E. coli(1pho); Sucrose specific porin from Salmonella typhimurium(1a0t); Matrix porin OmpF from E. coli(2omf); Maltoporin from E. coli(1mal); EspP autotransporter β domain from E. coli O157:H7(2qom); Osmoporin from Klebsiella pneumoniae(1osm).

