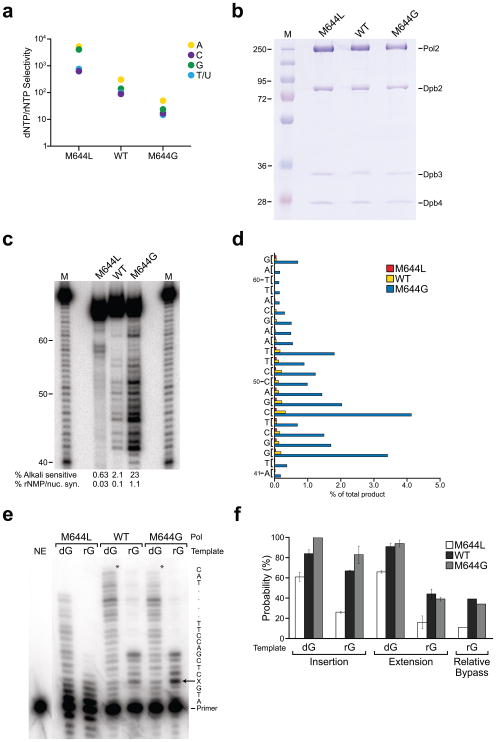
Figure 1. rNMP incorporation and bypass by Pol ε derivatives.
(a) Discrimination against rNMP insertion, determined as described in reference 2. (b) SDS-PAGE analysis of 3 μg of purified Pol ε derivatives, visualized with Coomassie Blue. (c) Stable rNMP incorporation into DNA, determined as described in reference 2. The marker lanes (M) depict products generated by Pol α prior to gel purification. The percentages of alkali sensitive product and the percentages of rNMP incorporation per nucleotide synthesized are shown below each lane. (d) Frequency of rNMP incorporation by M644L (blue bars), wild type (green bars), and M644G Pol ε (red bars) at each of 22 template positions. (e) Phosphorimage of rGMP bypass products for reactions incubated for 20 min. The template is shown on the right; X denotes dG or rG. The asterisks denote the position of full-length products. NE, no enzyme. (f) Insertion, extension, and relative bypass probabilities for M644L, wild type and M644G Pol ε. Values are percentages and error bars are standard deviations for three time points, calculated as described in reference 32.

