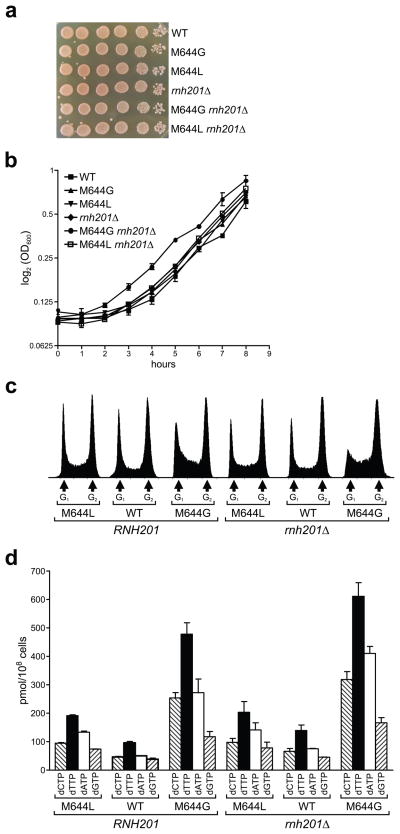
Figure 3. Characteristics of Pol ε strains ± RNase H2.
(a) Growth of serial dilutions of overnight cultures plated on YPDA agar plates. (b) Growth in liquid YPDA medium, represented as the mean ± SD. (c) Flow cytometry histograms obtained as described in reference 36. (d) Analysis of dNTP levels, determined as described in reference 2. Two independent isolates were analyzed for each genotype.

