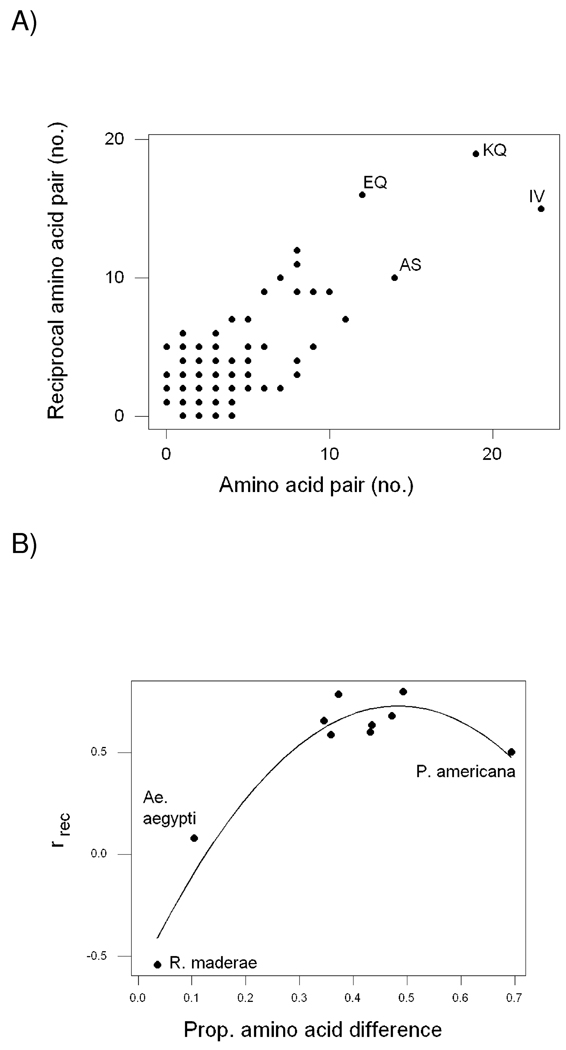
Figure 4.
(A) Plot of numbers of reciprocal amino acid pairs in the comparison between Tribolium castaneum 2 and Tribolium castaneum 1; the correlation coefficient (rrec) was 0.799 (P < 0.001). Several of the more commonly occurring amino acid pairs are indicated. (B) Plot of ruse vs. proportion of amino acid difference pairs of paralogous vitellogenins from 10 insect species. The points for the species with the two lowest values of the proportion of amino acid difference (P. maderae and Ae. aegypti) are indicated, as is that for the species with the highest proportion of amino acid difference (P. americana). The line is a quadratic regression (Y = −0.600 + 5.50X − 5.69X2; R2 = 0.939; P < 0.001).

