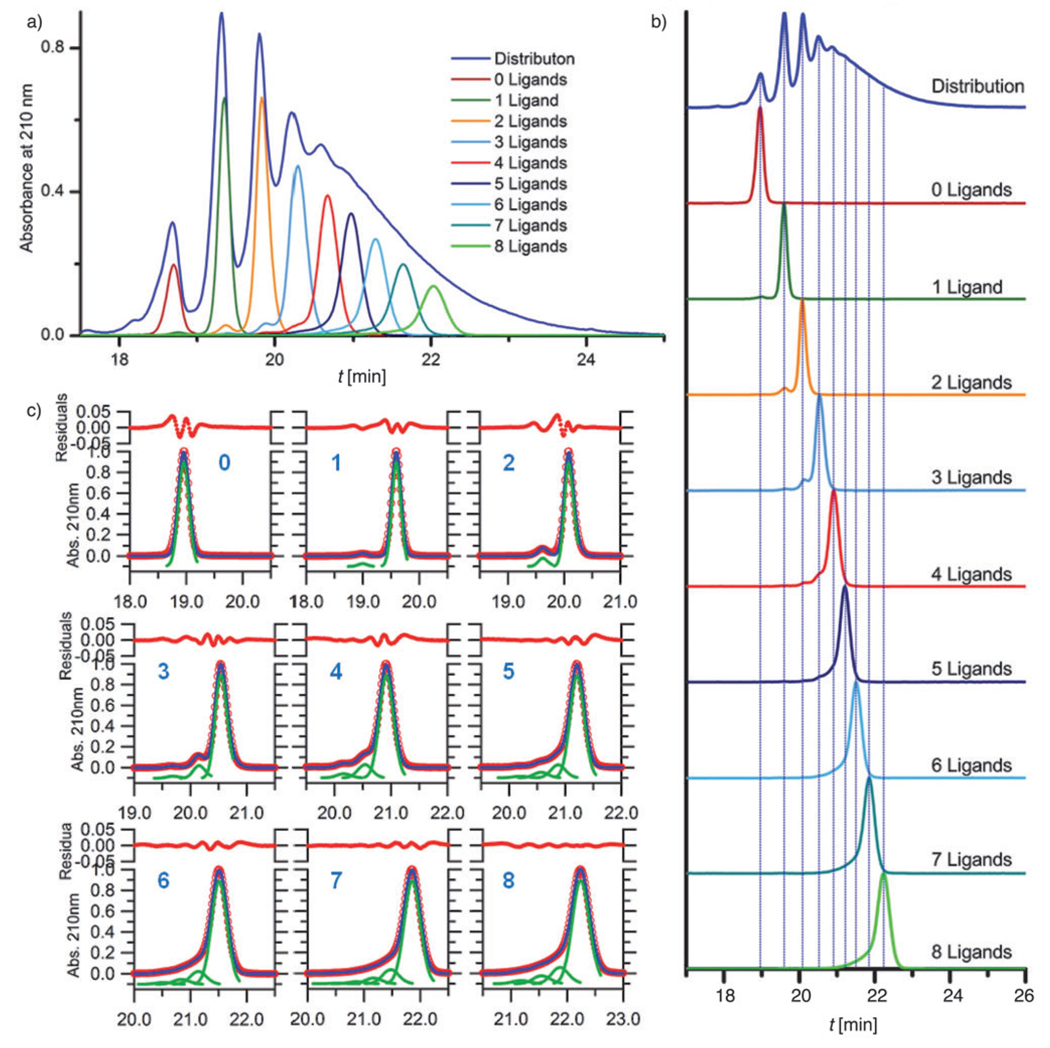
Figure 2.
Analytical HPLC analysis for the isolated dendrimer–ligand components. a) Baseline-corrected traces for dendrimer–ligand components with 0–8 ligands run immediately after the isolation process. The area of each peak is directly proportional to the amount of isolated material. The HPLC trace (normalized) for the dendrimer distribution with a mean of 4.3 ligands is also included. b) Traces for the isolated dendrimer–ligand components after purification (each trace baseline corrected and normalized). Blue lines show relationship between the isolated component and the material with the distribution of components. In addition to the major peak in each component, small amount of other components have been detected. c) The peak fitting method was used to quantify the purity of each isolated component. Fitting peaks are shown in green, with the summation of these peaks in blue. The HPLC data is shown in red circles. The residual values in panel c are multiplied by 106.

