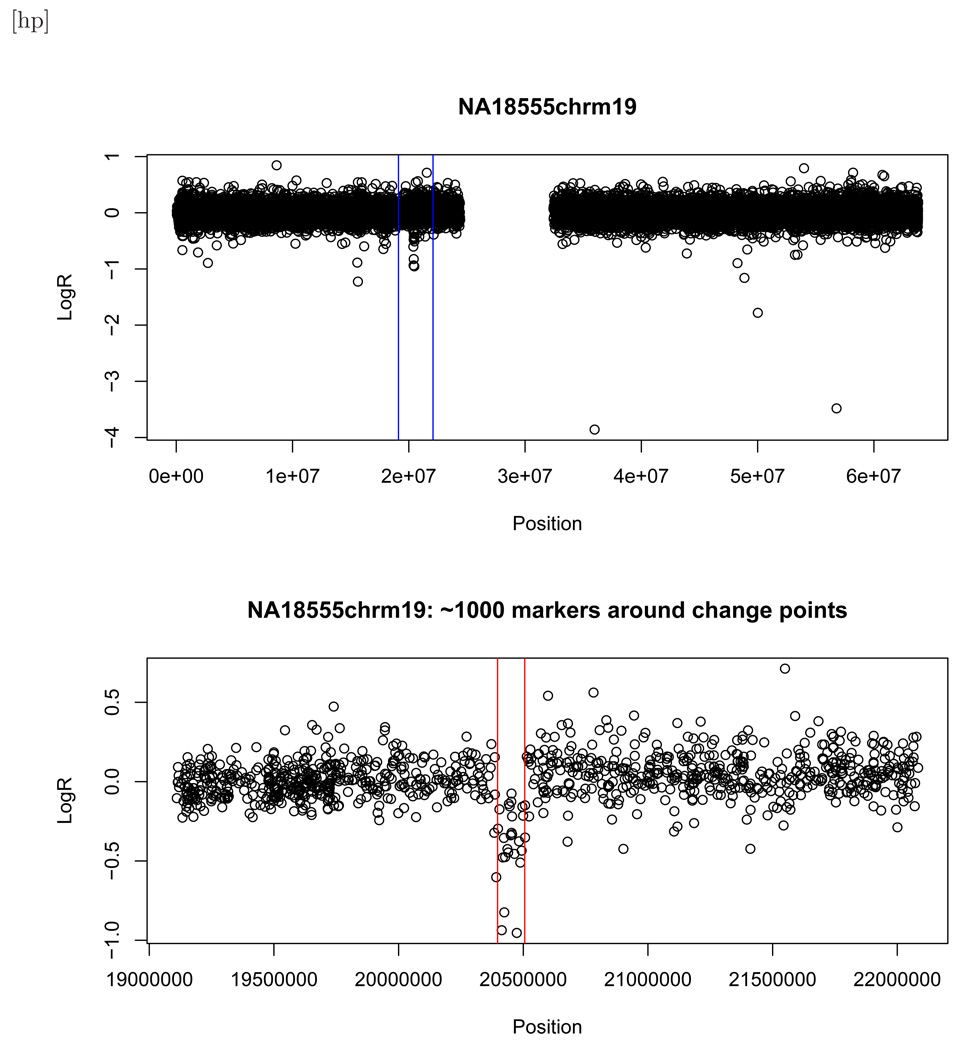
Figure 2.
Top panel: Scatter plot for NA18555 chromosome 19 (SNR = −3.71). The vertical lines indicate a small region that surrounds the validated change points. The blank spot is the centromere. Bottom panel: Zoomed-in scatter plot of the region that surrounds the change points. The vertical lines indicate the validated change points.

