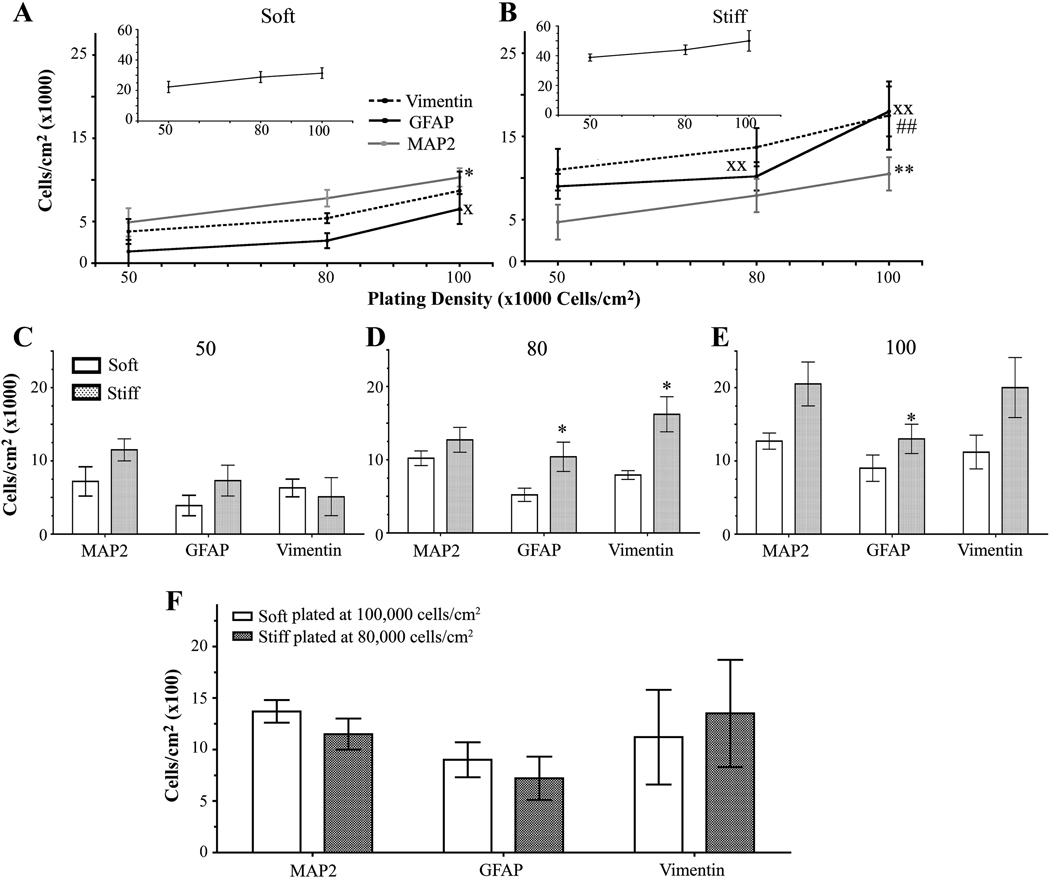
Figure 3.
Cell density changes seen with different substrate stiffnesses and initial plating densities. (A) When grown on soft gels and assessed on 12 DIV, the number of neurons and mature astocytes increased as initial plating density increased. The number of vimentin-positive cells did not change as initial plating density increased. Inset shows that the total number of cells remains unchanged with increased plating density. xp<0.05 for GFAP-positive cells determined by one-way ANOVA followed by Dunnett’s Multiple Comparison Test compared to 50,000 cells/cm2. *p<0.05 for MAP2-positive cells determined by repeated one-way ANOVA followed by Dunnett’s Multiple Comparison Test compared to 50,000 cells/cm2. (B) As initial plating density increased, the number of neurons increased and the number of mature astrocytes remained unchanged on stiff gels. Inset shows that the total number of cells remains unchanged with increased plating density. xxp<0.01 for GFAP-positive cells determined by repeated one-way ANOVA followed by Dunnett’s Multiple Comparison Test compared to 50,000 cells/cm2. **p<0.01 for MAP2-positive cells determined by repeated one-way ANOVA followed by Dunn’s Multiple Comparison Test compared to 50,000 cells/cm2. ##p <0.01 for vimentin-positive cells determined by repeated one-way ANOVA followed by Dunn’s Multiple Comparison Test compared to 50,000 cells/cm2 (C) No differences in the number of MAP2-, GFAP-, and vimentin-positive cells were observed between soft and stiff substrates when cells were initially plated at 50,000 cells/cm2. (D) Stiff substrates have an increased number of MAP2- and GFAP-positive cells when plated at an initial density of 80,000 cells/cm2 when compared to soft substrates. *p<0.05 determined by Mann-Whitney Test. (E) Stiff gels have an increased number of GFAP-positive cells when plated at a initial density of 100,000 cells/cm2 when compared to soft gels. *p<0.05 determined by paired t-test. (F) Mixed cultures plated on soft gels at 100,000 cells/cm2 or stiff gels at 50,000 cells/cm2 have the same number of MAP2-, GFAP-, and vimentin-positive cells. Data were combined averages of four to eight experiments. All data are represented as mean ± SEM.

