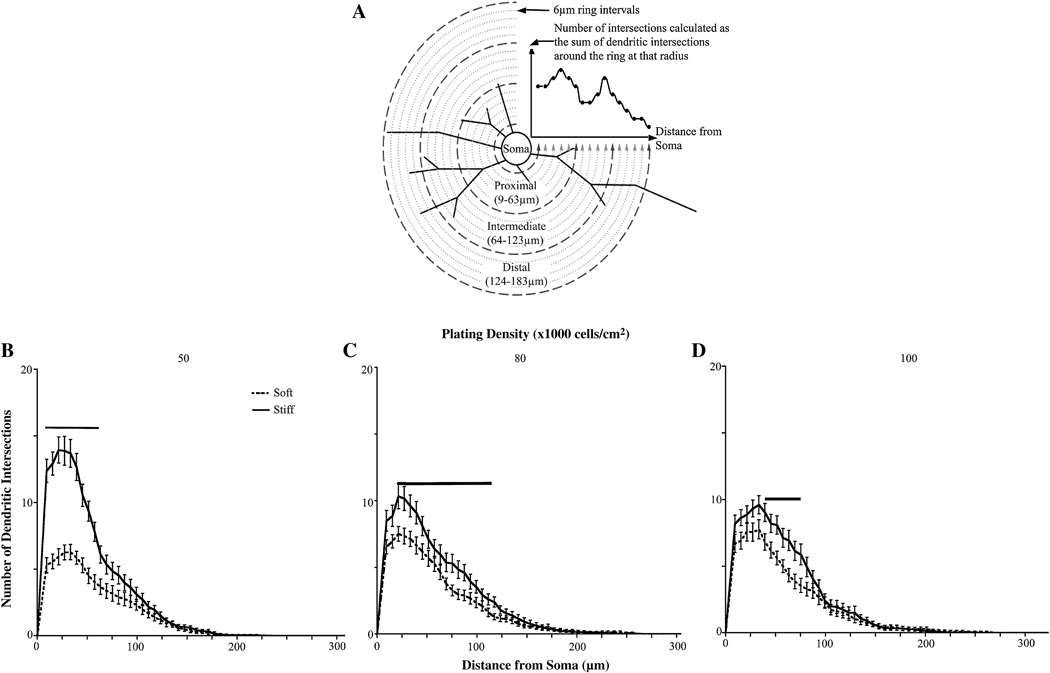
Figure 6.
Sholl analysis of neurons cultured on gels of varying rigidities. (A) Explanation of Sholl analysis. Concentric circles are drawn around the cell body. Dendritic intersections are counted at each circle. Proxmal dendrites are counted within 63 µm from the cell body, intermediate dendrites are counted within 123 µm from the cell body, and distal dendrites are between 123–183 µm from the cell body. (B) Sholl analysis of neurons plated at an initial cell density of 50,000 cells/cm2 (C) Sholl analysis of neurons plated at an initial cell density of 80,000 cells/cm2 (D) Sholl analysis of neurons plated at an initial cell density of 100,000 cells/cm2. For all conditions, neurons showed increased proximal and intermediate branches when cultured on stiff versus soft gels. (See Tables S1–3 for p values). Bars indicate significance with p<0.05. Data were averaged across four experiments. All data are represented as mean ± SEM. Numbers of cells for each condition are listed for 50,000, 80,000, and 100,000 cells/cm2, respectively. Soft gels: n=28; 37; 34. Stiff gels: 35; 30; 33.

