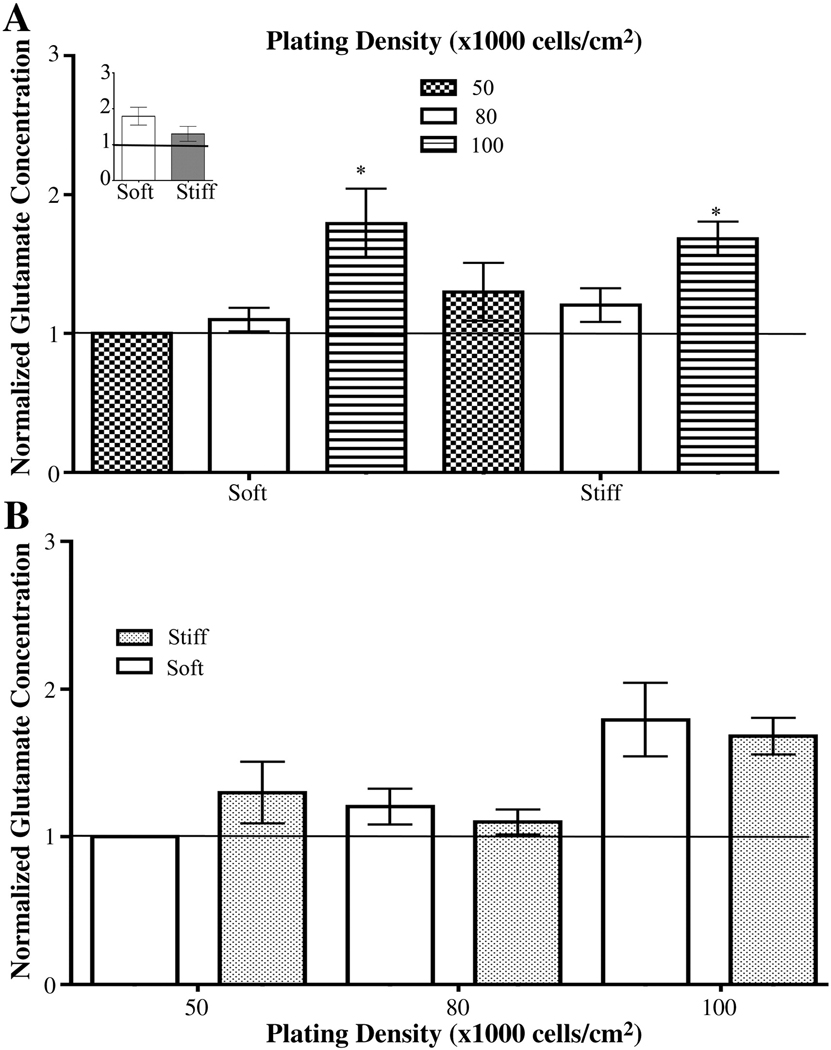
Figure 8.
Glutamate concentrations found in the media of cells cultured under different conditions. (A) Glutamate concentration in the media increased when cells were plated at 100,000 cells/cm2 on both soft and stiff gels gels. *p<0.05 for soft gels determined by Kruskal-Wallis followed by Dunn’s Multiple Comparison Test compared to cells plated at 50,000 cells/cm2.. *p<0.05 for stiff gels determined by repeated one-way ANOVA followed by Dunnett’s Multiple Comparison Test compared to cells plated at 50,000 cells/cm2. Glutamate concentration in the media did not change as initial plating density increased. Inset shows that glutamate did not change when cells were plated such that final cell numbers were the same on the soft and stiff gels. (B). Glutamate concentrations were the same in media taken from cultures on soft and stiff gels with the same initial number of cells. Data were averaged across five experiments. All data are represented as mean ± SEM.

