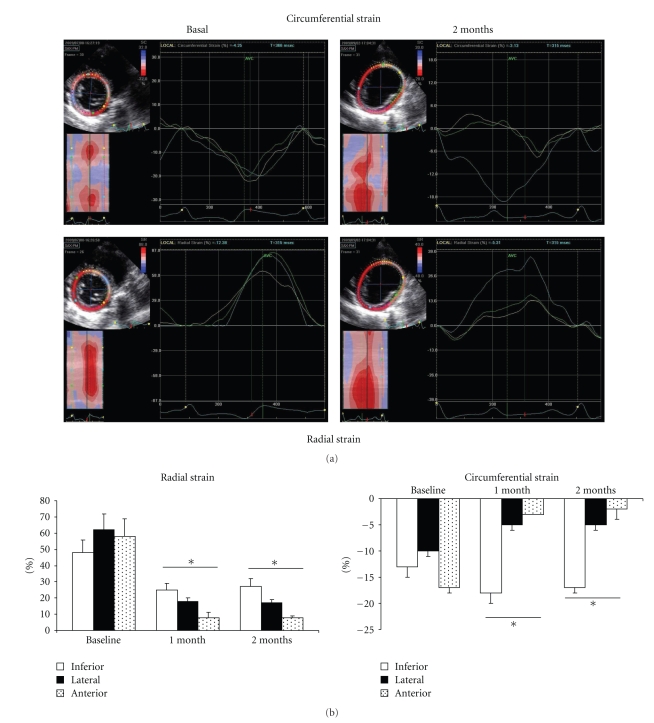
Figure 5.
(a) Echocardiographic visualisation of the development of radial and circumferential deformation in healthy and ischemic zones. Quantification of peaks in circumferential and radial strain in ischemic and control areas showed substantial anomalies in radial and circumferential deformations alike, both on the anterior and lateral surface of the heart, with compensation marks on the inferior healthy surface (*P < .01 compared to basal time). (b) Graphic representations of anomalies in radial and circumferential deformation in walls of myocardium.

