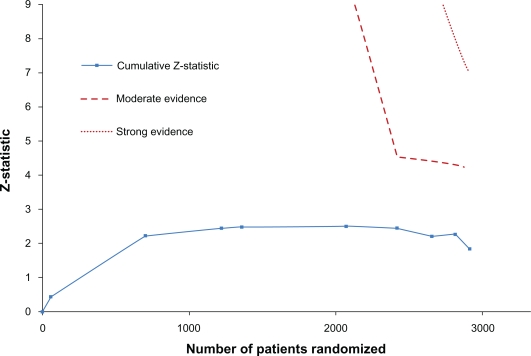
Figure 2.
Trial sequential analysis (TSA) monitoring boundaries for moderate and strong evidence (the downward sloping lines) in the current meta-analysis.
Notes: The monitoring boundaries were constructed using the Lan-DeMets alpha-spending approach corresponding to the O’Brien-Fleming boundaries. The monitoring boundaries for moderate evidence (alpha =5%, beta =20%) were based on information size required for moderate evidence (10,508 patients). The monitoring boundaries for strong evidence (alpha =1%, beta =10%) were based on information size required for strong evidence (19,920 patients). Both information size calculations were based on the assumption of a 5% incidence rate in the control group, and a 25% relative risk reduction. The cumulative Z-statistic does not cross above either of the two monitoring boundaries, and thus, there is neither moderate or strong statistical evidence (significance) to support a treatment effect of at least a 25% relative risk reduction.

