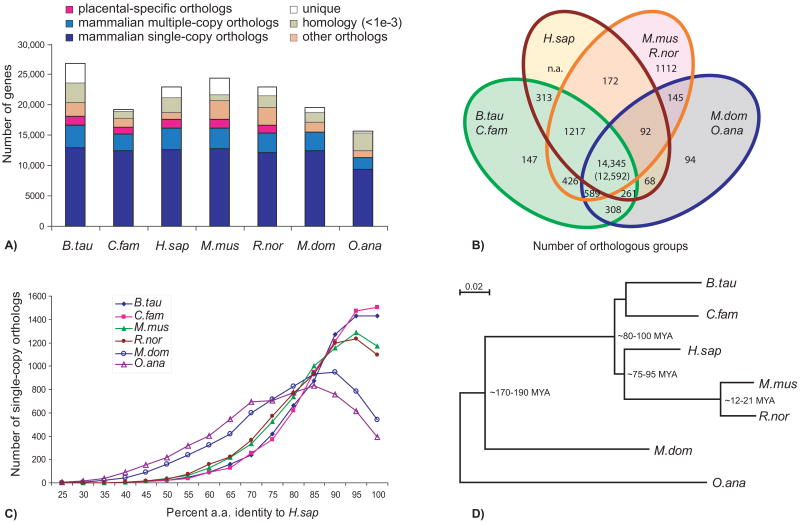
Fig. 1.
Protein orthology comparison among genomes of cattle, dog, human, mouse and rat (Bos taurus, Canis familiaris, Homo sapiens, Mus musculus, Rattus norvegicus, representing placental mammals), opossum (Monodelphis domestica; marsupial), and platypus (Ornithorhynchus anatinus; monotreme). (A) The majority of mammalian genes are orthologous, with over half preserved as single-copies (dark blue); a few thousand have species-specific duplications (blue); another few thousand have been lost in specific lineages (orange). We also show those lacking confident orthology assignment (green), and those that are apparently lineage specific [unique (white)]. Placental-specific orthologs are shown in pink. Single- or multiple-copy genes were defined on the basis of representatives in human, bovine or dog, mouse or rat, and opossum or platypus. (B) Venn diagram showing shared orthologous groups (duplicated genes were counted as one) between laurasiatherians (cattle and dog), human, rodents (mouse and rat), and non-placental mammals (opossum and platypus) on the basis of the presence of a representative gene in at least one of the grouped species (as in A). (C) Distribution of ortholog protein identities between human and the other species for a subset of strictly conserved single-copy orthologs. (D) A maximum likelihood phylogenetic tree using all single-copy orthologs supports the accepted phylogeny and quantifies the relative rates of molecular evolution expressed as the branch lengths.

