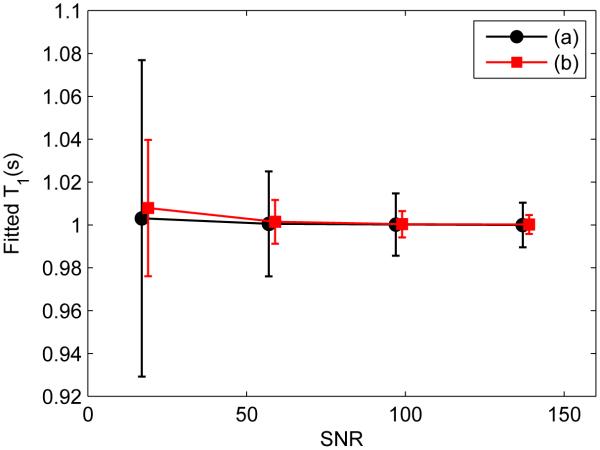
Figure 3.
Monte Carlo simulation of T1 fitting results vs. SNR using schemes: (a) a ten-point conventional scheme (black) with ti logarithmically varied between 4 ms and 6 s, and td of 6 s; (b) a three-point scheme (red) optimized for parameter values of M0 = 1, T1 =1 s, and Sf = −1. Data points are slightly shifted to allow a clear comparison. The uncertainties are normalized for same total acquisition time.

