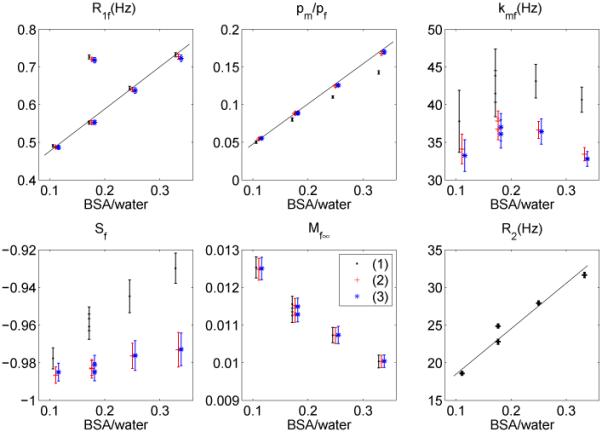
Figure 6.

Measured R1f, pm/pf, kmf, Sf, Mf∞ and R2 as a function of BSA weight vs. water weight ratio using acquisition schemes (1) (black), (2) (red) and (3) (blue), where Mf∞ is plotted in arbitrary units. Data points are shifted for a clear comparison. For scheme (1), first-order approximations were employed to process data. Note that the results from two 15% BSA samples are plotted, both with and without MnCl2. The MnCl2 changes R1f and R2 while having little effect on the fitted MT parameters, confirming that SIR-FSE is a true qMT sequence, and not just a function of the relaxation rates.
