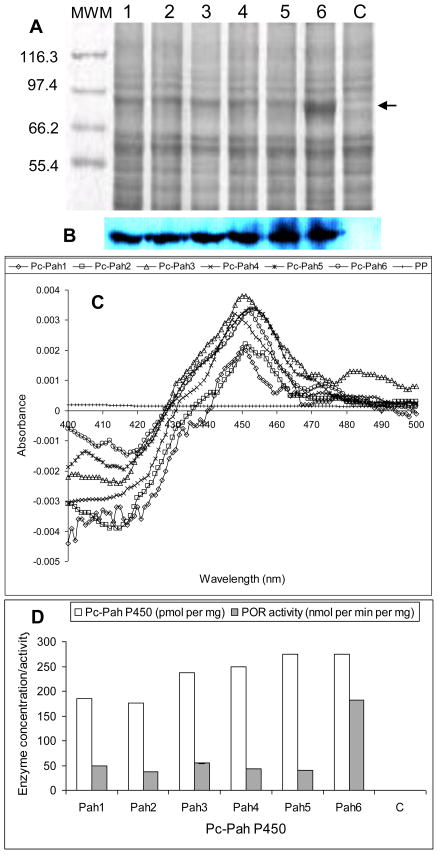
Figure 2.
Co-expression and activity characterization of Pc-Pah P450 monooxygenases and the homologous P450 reductase partner (Pc-POR) in Pichia pastoris. The expressed enzymes were assessed in the yeast microsomes prepared as described under Materials and Methods section. (A) SDS-PAGE analysis of the microsomal protein preparations from recombinant P450-POR yeast clones Pc-Pah1 through Pc-Pah6 (lanes 1–6) and negative control yeast (lane c). Proteins were separated on 7% SDS-PAGE and detected by staining with SYPRO Ruby (BioRad). The protein band coinciding with Pc-POR (estimated 81.6 kDa) is shown by an arrow. (B) Western blot analysis of Pc-Pah proteins using anti-his antibody. (C) Characteristic CO-difference spectra for the individual Pc-Pah proteins (Pc-Pah1 through Pc-Pah6) and negative control. (D) P450 enzyme concentrations and POR activity levels of the individual Pc-Pah clones versus the negative control (C). P450 concentration values are based on the CO-difference spectra shown in panel C. POR activity values are the means for three biological replicates (the SD values varied between 0.07 and 0.23).

