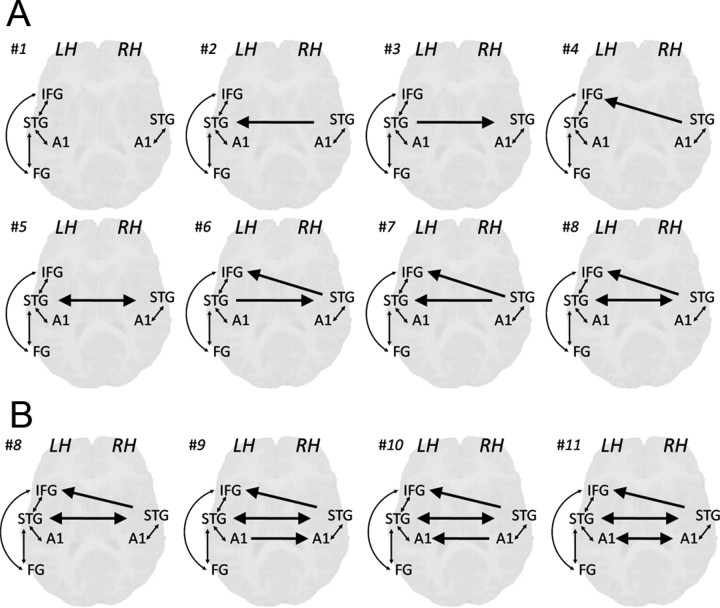
Figure 2.
Modulatory effects in the alternative DCM models for model comparison. A, Models compared at the first stage, testing interhemispheric connectivity of right STG. B, Models compared at the second stage, testing interhemispheric connectivity between left and right A1. Arrows indicate modulated connections, bold arrows indicate interhemispheric modulations. LH, Left hemisphere; RH, right hemisphere.

