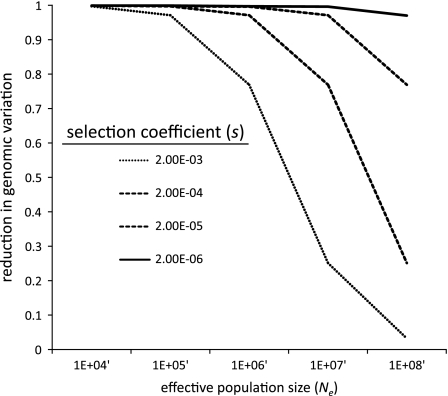
FIG. 1.—
where θ = 4Neμ (where Ne is the effective population size and μ is the mutation rate per site per generation), κ = 0.075 (a constant), λ = the rate of adaptive substitutions per site per generation, and γ = 2Nes (where s is the selection coefficient). By fixing μ, r, and λ, the effects of varying Ne on levels of polymorphisms are plotted for different values of s.

