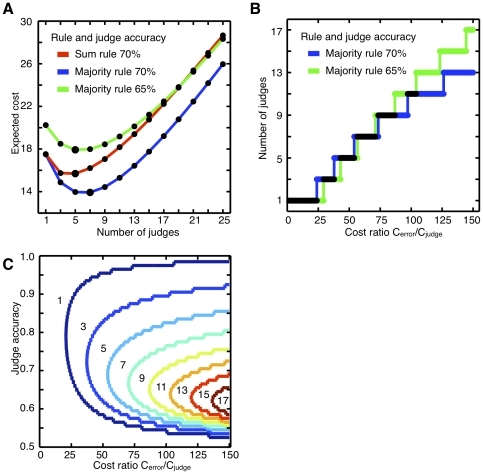
Figure 3. The paradox of the optimal number of judges.
(A) The expected cost function (Equation 1) applied to the judge accuracy curve shown in Figure 2E. The cost per error is 55 times the cost per judge. The black line is the sum rule with 70% accurate judges, while the gray lines are majority rule (solid for 70% accurate judges and dashed for 65% accurate judges). The optimal number of judges, shown with the bigger dot, is different for the majority rule with 70% accurate judges. (B) The optimal number of judges as a function of the cost ratio. The majority rule with 70% accurate judges (red) and 65% accurate judges (blue) both increase the optimal number of judges as the cost ratio increases but diverge at points. (C) Contour plot of the optimal number of judges for majority rule as a function of the cost ratio and the judge accuracy. The reds indicate higher number of judges while the blues indicate lower numbers.

