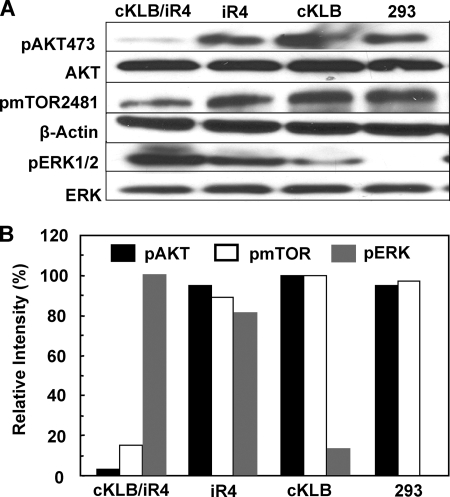
FIGURE 8.
Selective depression of AKT and mTOR activity by the KLB-FGFR4 partnership. A, 293 cells were treated with 300 ng/ml Tet overnight followed by addition of 1 μg/ml FGF19 for 6 h and analysis of lysates by immunoblot with the indicated antibodies. B, quantification of pAKT, pmTOR, and pERK. The relative levels of pAKT to total AKT, pmTOR to β-actin, and pERK to total ERK were calculated from a densitometric scan of band intensities in A. 100% was the most intense band from each protein among samples.

