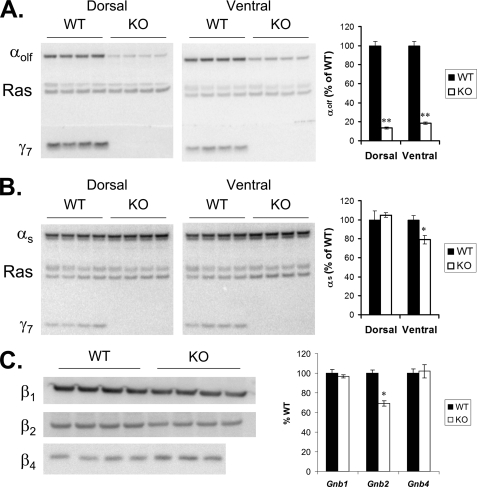
FIGURE 3.
A, immunoblot of αolf, γ7, and Ras on membranes prepared from micropunch samples of dorsal striatum (15 μg/lane) and ventral striatum (10 μg/lane) of four Gng7−/− mice (KO) and four wild-type littermates (WT) on a C57BL/6 genetic background. B, immunoblot of αs, γ7, and Ras in membranes described above. C, immunoblot of β1, β2, and β4 on membranes prepared from whole striatum of Gng7−/− mice and wild-type littermates (20 μg/lane) on a C57BL/6 genetic background. Graphs depict quantitation of 1 or 2 immunoblots for each subunit, values are normalized to Ras for each lane, then expressed as percent of wild-type (% WT) (n = 4 to 8 mice in each group; *, p < 0.01; **, p < 1 × 10⁻⁶).

