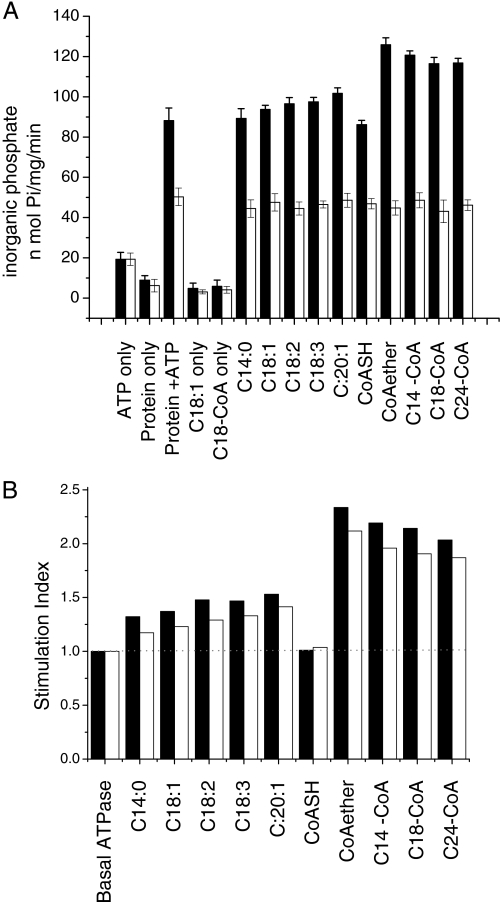
FIGURE 8.
Effects of fatty acids and fatty acyl-CoAs on the ATPase activity of CTS. ATPase activity was measured in the presence of 10 or 100 μm fatty acids or fatty acyl-CoAs using peroxisomes (10 μg of protein) isolated from pxa1Δ cells transformed with CTS/pEL30 (black bars) or vector lacking insert (open bars). A, ATPase activities measured in the presence or absence of 10 μm fatty acids/fatty acyl-CoAs; bars represent mean ± S.E. (n = 3). B, the ATPase activities obtained in A, or in a similar experiment performed using 100 μm fatty acids/fatty acyl-CoAs, were used to calculate the CTS ATPase activity relative to that seen in the basal state in the absence of substrate (“stimulation index”), according to the formula: (CTS expressing (stimulated) − control (stimulated))/(CTS (unstimulated) − control (unstimulated)). The basal ATPase activity is defined as having a stimulation index of 1 (represented by a broken line across the graph) and values above 1 indicate the degree of stimulation relative to the basal ATPase activity of CTS. Black bars, 100 μm substrate; open bars, 10 μm substrate.

