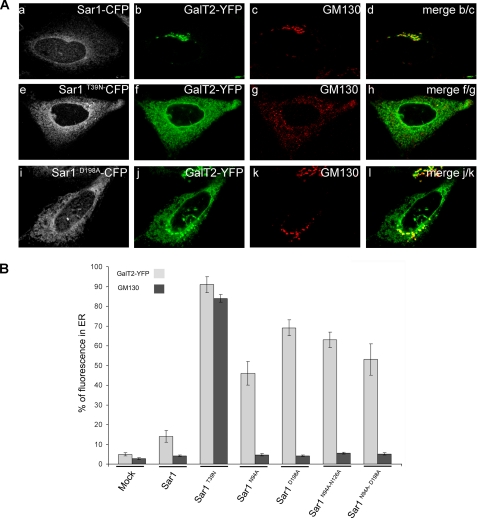
FIGURE 3.
Sar1D198A expression specifically redistributes GalT2 to the ER. A, top row, cells co-expressing Sar1-CFP (panel a, white) and GalT2-YFP (panel b, green) were immunostained for the Golgi marker GM130 (panel c, red); panel d is the merge of panels b and c. Middle row, cells co-transfected with Sar1T39N-CFP (panel e, white) and GalT2-YFP (panel f, green) were immunostained for the Golgi marker GM130 (panel g, red); panel h is the merge of panels f and g. Bottom row, cells co-expressing Sar1D198A-CFP (panel i, white) and GalT2-YFP (panel j, green) were immunostained for the Golgi marker GM130 (panel k, red); panel l is the merge of panels j and k. B, quantification of GalT2 in the ER. The fluorescence intensity of GalT2 (light gray) and of GM130 (black) in cells expressing GalT2 alone (mock) or co-expressing GalT2 with either Sar1 alone, Sar1T39N, or Sar1 with different alanine substitutions in site A as indicated on the abscissa was quantified with Metamorph™. For details see “Experimental Procedures.” The values express the percentages ± S.E. of the total fluorescence of GalT2 (n = 30) and of immunolabeled GM130 (n = 20) in ER membranes.

