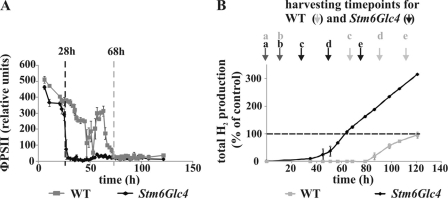
FIGURE 1.
Correlation between photosynthetic quantum yield and H2 production rates of C. reinhardtii WT and Stm6Glc4 during the shift from aerobiosis to anaerobiosis (induced by S-deprivation). A, quantum yield of PSII (ΦPSII) of sealed, sulfur-depleted C. reinhardtii cultures. B, total H2 production during S-deprivation. Harvesting time points (a–e) are labeled. Each curve represents an average of at least three biological replicates. Error bars indicate standard errors. The amount of H2 produced in the WT was set to 100%.

