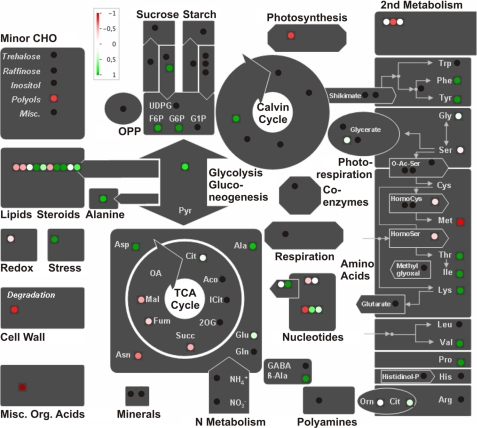
FIGURE 10.
Schematic representation of the relative changes of metabolite levels during H2 production in the mutant strain Stm6Glc4. The figure was prepared with the MapMan visualization platform (38).4 Sixty metabolites were assigned to the major cellular pathways. Metabolites that increased during H2 production are marked in green; metabolites that decreased are marked in red. Metabolites with no changes are marked in white. Black points represent metabolites present in the MapMan platform, which were not detected in our metabolomic study.

