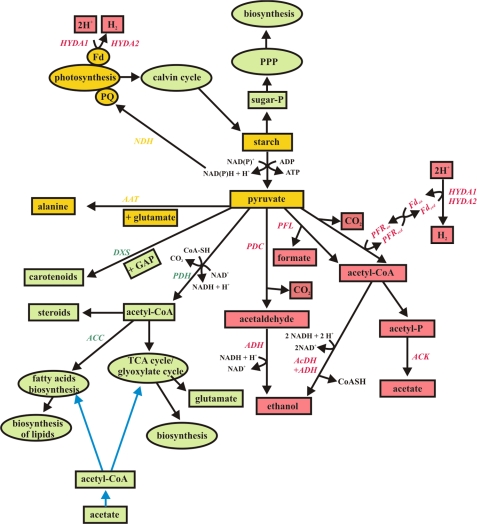
FIGURE 11.
Visualization of the pyruvate metabolism before and during H2 production. Green color represents metabolites/pathways present during the aerobic state; red color represents metabolites/pathways present during the anaerobic state, yellow color represents pathways occurring in both states. Blue arrows symbolize acetate uptake and feeding. AAT, alanine aminotransferase; ACC, acetyl-CoA carboxylase; AcDH, acetaldehyde dehydrogenase; ACK, acetate kinase; ADH, alcohol dehydrogenase; DXS, 1-deoxy-d-xylulose-5-phosphate synthase; GAP, glyceraldehyde-3-phosphate; Fd, ferredoxin; HYDA1 and HYDA2, hydrogenases; NDH, NAD(P)H dehydrogenase; PDC, pyruvate decarboxylase; PDH, pyruvate dehydrogenase complex; PFL, pyruvate formate lyase; PFR, pyruvate ferredoxin oxidoreductase; PPP, pentose phosphate pathway; PQ, plastochinon pool; and TCA cycle, citric acid cycle.

