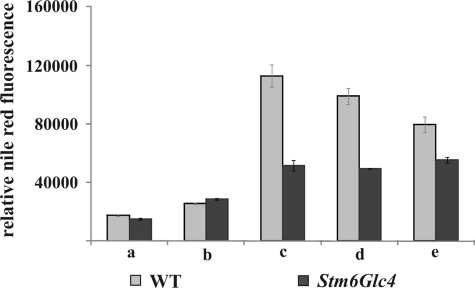
FIGURE 5.
Relative amounts of lipids measured by relative fluorescence after Nile Red staining at time points before and during H2 production process in the WT (gray) and Stm6Glc4 (black). 1.2 × 10⁷ cells per ml were used. Time points a–e are labeled as described (see Fig. 1B). Each value represents an average of at least eight measurements (two biological replicates, four technical replicates). Error bars indicate standard errors.

