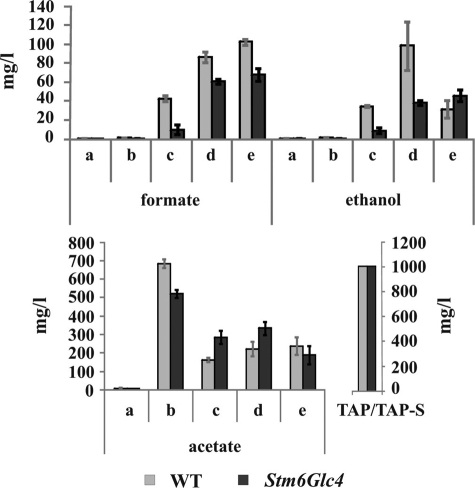
FIGURE 6.
Enzymatic analysis of fermentative products during H2 production process in WT (gray) and Stm6Glc4 (black). Time points are labeled with a–e (see Fig. 1B). Each value represents an average of at least three measurements (three biological replicates). Error bars indicate standard errors.

