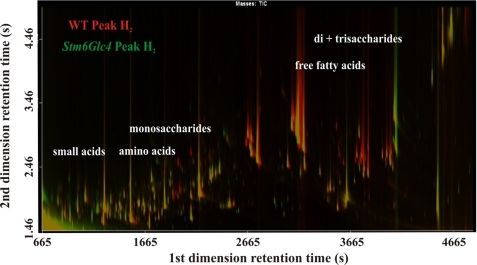
FIGURE 8.
Overlay of total ion current chromatograms displayed as a contour plot of two-dimensional GCxGC-TOFMS analysis. Chromatograms of WT and Stm6Glc4 during peak H2 production (time point e) were selected. Red or green peaks represent metabolites with significant differences in abundance with “green” representing higher amounts in Stm6Glc4 and “red” representing higher amounts in the WT. Yellow peaks represent metabolites that were equally abundant in both strains. Regions corresponding to specific compounds (e.g. small organic acids, amino acids, free fatty acids, and monosaccharides) are indicated. Differences between two samples regarding the amount of specific compounds can be easily detected and subsequently analyzed by this method.

