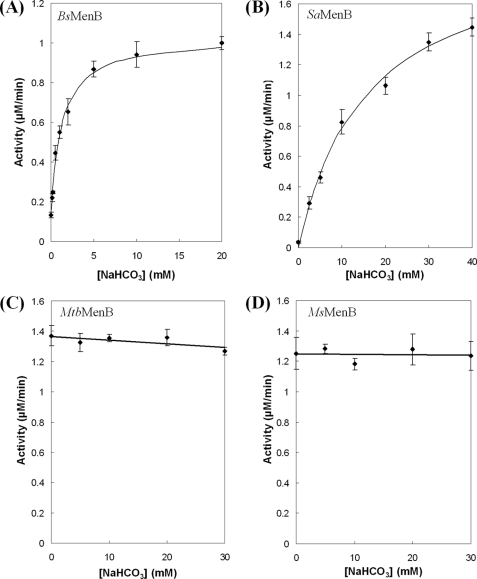
FIGURE 4.
Effects of bicarbonate on the activity of DHNA-CoA synthases from different bacterial species. A, BsMenB; B, SaMenB; C, MtbMenB; D, MsMenB. Solid lines in A and B represent the curve-fitting results with a saturation model under the assumption that there is a low background level of bicarbonate in the buffer. Error bars indicate S.E.

