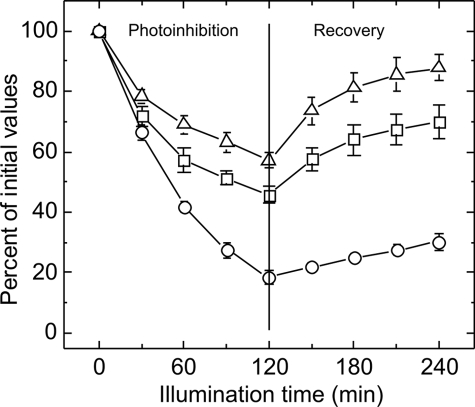
FIGURE 4.
Effect of high/low light illumination on the initial amplitudes of flash-induced fluorescence decay in WT (triangles), ΔpsbA3 (circles), and ΔpsbA1A2 (squares) mutants. Cells grown at 50 μmol m−2 s−1 were exposed to 500 μmol m−2 s−1 light for 2 h followed by a 2-h recovery period under normal growth light (50 μmol m−2 s−1). Data are presented as mean ± S.D. of three independent biological repetitions. In some instances, the error bars are smaller than the symbols.

