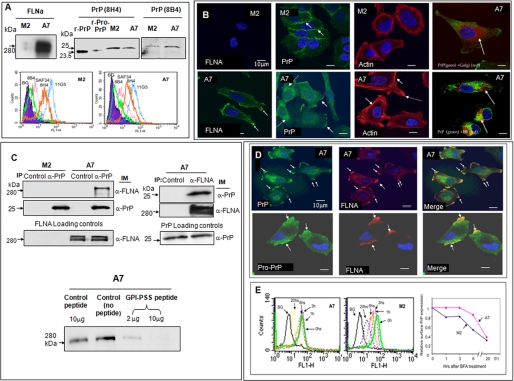
FIGURE 1.
Expression of FLNA and pro-PrP in M2 and A7 cells. A, immunoblots show that only A7 cells express FLNA. Both M2 and A7 cells express PrP. PrP from M2 and A7 cells has a molecular mass of about 26 kDa. A recombinant mature PrP23–231 (r-PrP) and a recombinant pro-PrP23–253 (r-pro-PrP) were included as molecular mass markers. Pro-PrP from A2 and M7 cells migrates slower than recombinant pro-PrP23–253. This likely reflects the conformational difference between recombinant pro-PrP23–253 and native pro-PrP. Recombinant pro-PrP23–253 has to be solubilized and refolded in urea, which might cause the protein to be more compacted. This experiment was repeated at least three times with comparable results. Histograms show that PrP on the cell surface of M2 and A7 cells reacts with multiple anti-PrP mAbs. The epitopes of the mAbs are shown in supplemental Fig. S1A. BG, background staining with irrelevant mAb D7C7. This experiment was repeated at least three times with comparable results. B, microscopic images show the expression of FLNA in A7 cells but not in M2 cells. The distributions of PrP and actin in M2 and A7 cells also differ. For organelle-specific markers, a rabbit anti-calnexin antibody was used to mark the ER, and a Bodipy™F-C5 ceramide-BSA was used to locate the Golgi. This experiment was repeated at least three times with comparable results. C, immunoblots show that in A7 cells PrP co-purifies with FLNA and vice versa. Loading controls show the levels of PrP or FLNA in cell lysates before co-immunoprecipitation (IP) and an immunoblot (IM). This experiment was repeated at least three times with comparable results. Immunoblots show that co-purification of FLNA with PrP can be competed with a PrP GPI-PSS synthetic peptide but not a control peptide. This result was confirmed at least twice. D, microscopic images show the co-localization of pro-PrP and FLNA in A7 cells. This result was confirmed at least three times. E, histograms show that cell surface PrP on A7 cells has a longer half-life. A7 and M2 cells were cultured with BFA for various lengths of time to prevent the transit of newly synthesized PrP to the cell surface. At different times after culture, cells were prepared and stained with an anti-PrP mAb, 8H4. The levels of cell surface PrP were then quantified by flow cytometry. Mean fluorescent intensities of control cells or cells treated with BFA at time 0 were arbitrarily defined as 1. This result was confirmed at least twice.

