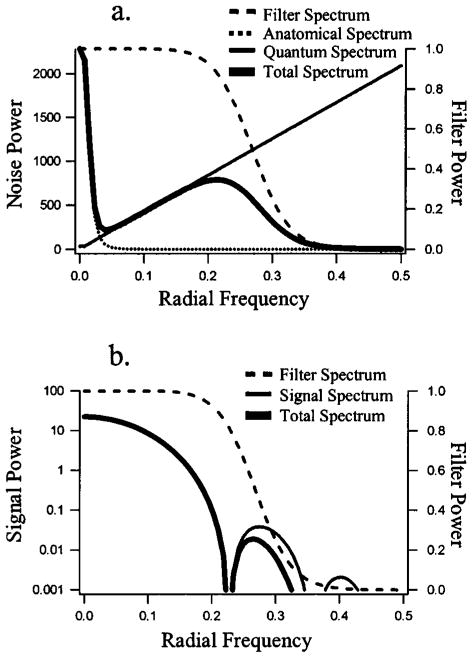
Fig. 2.
Noise and signal power spectra. Plots of signal and noise power spectra as a function of radial frequencies (in pixels−1). (a) Components of the noise-power spectrum (NPS). The total NPS is the sum of the quantum and anatomical components multiplied by the filter spectrum. (b) Components of the signal spectrum. The total signal spectrum is the product of the signal spectrum and the filter spectrum. Note that the signal power is plotted on a logarithmic scale to capture the low-amplitude peaks at 0.28 and 0.40 pixels−1.

