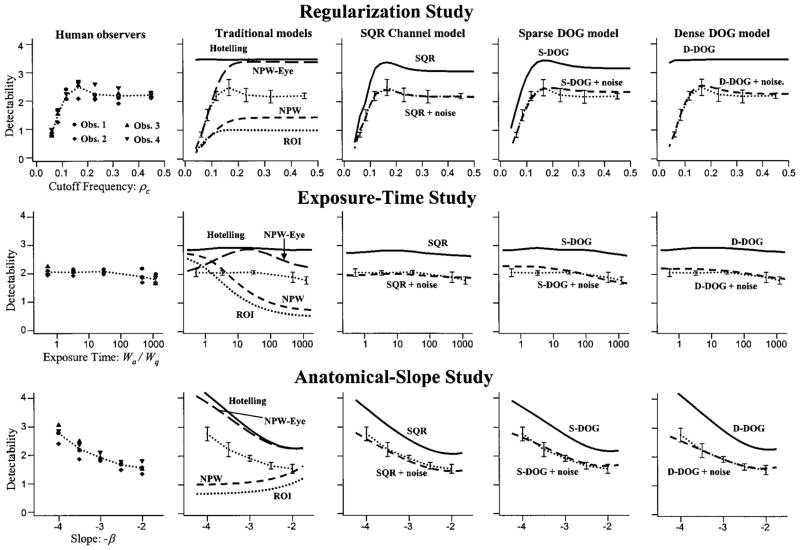
Fig. 7.
Human-observer performance and model fits. Each row of plots corresponds to the named study (regularization, exposure time, and anatomical slope). Y-axis labels on the left apply across the entire row. The first column of plots shows the performance of all four subjects. For reference, average human-observer performance is plotted with 1-standard-deviation errorbars in all the model-observer plots as well. The second column gives the performance of the Hotelling observer, the nonprewhitening (NPW) observer, the region-of-interest (ROI) observer, and the eye-filtered nonprewhitening (NPW-eye) observer. The remaining columns show the performance of channelized-Hotelling observers with the square channels (SQR), the three-channel difference of Gaussians (S-DOG), and the ten-channel difference of Gaussians (D-DOG), both with and without internal noise (+noise).

