
Figure 3.
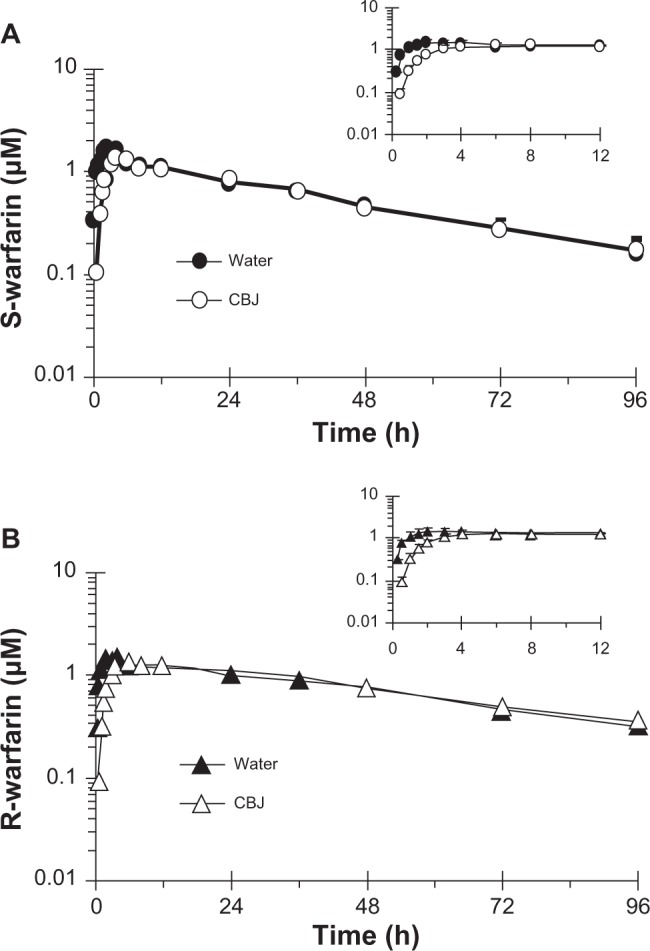
Geometric mean concentration-time profile (0–96 hours) of S-warfarin (A) and R-warfarin (B) for 16 healthy volunteers given three × 240 mL glasses of water or sweetened double-strength cranberry juice (CBJ) E and a single oral dose of warfarin (10 mg). Insets depict the 0–12-hour time profiles. Symbols and error bars denote geometric means and upper limits of the 90% confidence interval, respectively.