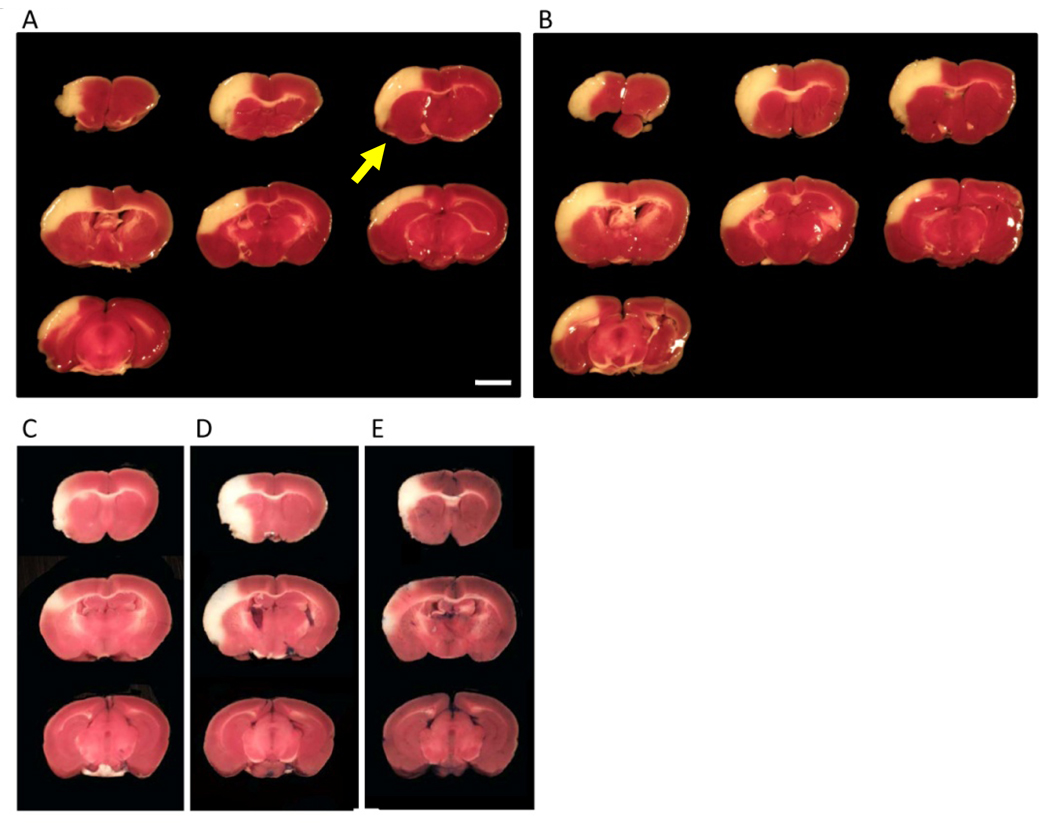
Figure 3. TTC images obtained 24 after stroke.
(A,B) Representative images of TTC-stained tissue 24 hours after induction of stroke in CB-17 mice. Similar to the MRI images of SCID mice (Figure 2), reproducible cortical ischemia was observed by TTC staining, comparing the results in different animals. (C–E) Representative images of TTC staining obtained from different C57BL/6 mice are shown. In contrast to the reproducibility of SCID and CB-17 mice, lesion size and even location varied substantially in C57BL/6 mice comparing different animals. Scale bar: 2 mm (A). The arrow indicates the portion around the area subject to electric coagulation (A).

