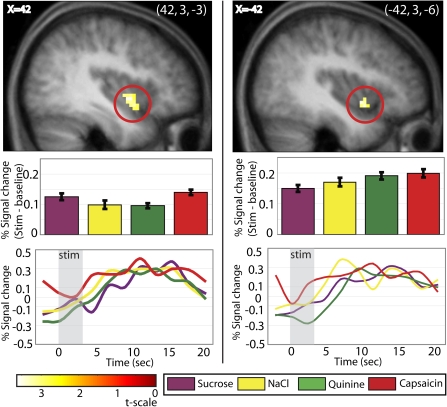
Figure 3.
The insula responds to all stimuli. Response in the insula (sagittal sections at x = −42 on the left and x = 42 on the right) resulting from the conjunction analysis of [capsaicin + sweet + salty + bitter]. T-map is thresholded at P < 0.005 and k > 3 voxels. For this and successive pictures, bar graphs show activity in peak voxel within circled brain region in response to each stimulus (minus its baseline) in percent signal change, averaged over subjects. Error bars represent 2 standard error of the mean. Activations are significant at P < 0.05 FDR-corrected across regions of interest. The line graph displays the time course of the signal (stimulus minus baseline), extracted from the voxel responding maximally to each stimulus in this area (percent signal change, averaged over subjects). We note that the time-course data and bar graphs may not correspond exactly because the bar graphs reflect data fitted to the canonical HRF, whereas the time courses are extracted using a finite impulse response model in the RFXplots toolbox (Glascher 2009).

