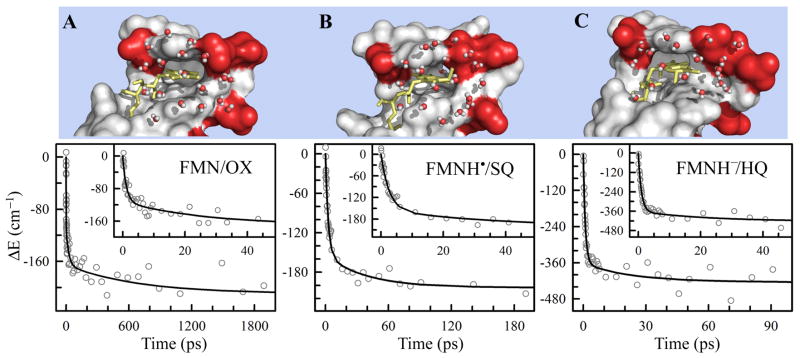
Figure 5.
Upper panel: Surface-map representation of a snapshot of the function site of flavodoxin in (A) OX (B) SQ and (C) HQ states from 1-ns MD simulations. Only water molecules within 6Å from the isoalloxazine ring are shown. The negatively charged residues are indicated in red color. Lower panel: Solvation responses at the function site of flavodoxin in three redox states represented by the stabilization energy changes (ΔE) with time. The insets show the responses at short time scale.

