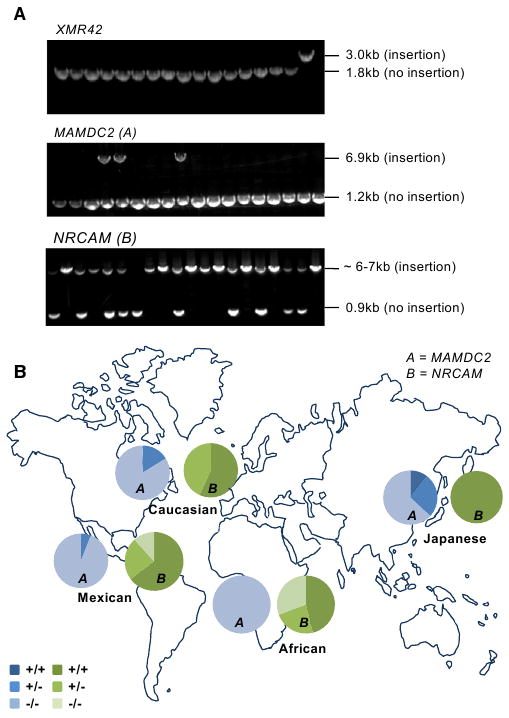
Figure 6. Polymorphism of L1(Ta)s.

(A) Agarose gel images showing genotyping PCR products for three different L1(Ta) insertion sites in 17 individuals. In each case, primers were designed to flank the L1(Ta) insertion position identified by TIP-chip. Top panel shows a 1.2 kb insertion unique to the proband studied; about 600 other individuals were homozygous or hemizygous for the empty allele (i.e., lacking this X chromosome L1(Ta)). Middle gel shows an intronic L1(Ta) insertion in MAMDC2 on chromosome 7. Three genotypes were observed: (1) homozygous present (one band at 6.9 kb); (2) heterozygous (two bands, 6.9 kb and 1.2 kb); (3) homozygous absent (a single band at 0.9 kb). The third insertion site shown is within NRCAM on chromosome 9 (∼6–7 kb amplicon represents insertion allele, 0.9 kb represents empty allele).
(B) Pie charts indicate genotype distribution for two representative nonreference L1(Ta)s (not included in hs_ref) identified by TIP-chip studies of an individual (see Figure 3) across two human ethnic diversity panels. The total sample size of both diversity panels is 198 people. The Caucasian, Mexican and Japanese sample groups were represented most highly (n = 37, 17 and 18 respectively) and were used for Hardy-Weinberg calculations. For Locus A (MAMDC2) the allele frequencies for each population, as well as the chi square values for the biggest population groups are as follows: Caucasians (0.08; χ2 = 0.29); Mexican (0.03; χ2 = 0.02); Japanese (0.25; χ2 = 1.41); African (0.00, n = 13). For Locus B (NRCAM) the allele frequencies for each population, as well as the chi-square values for the biggest population groups are as follows: Caucasians (0.79; χ2 = 2.82); Mexican (0.77; χ2 = 2.04); Japanese (1.00); African (0.58, n = 13).
See also Figure S5 and Table S3.
