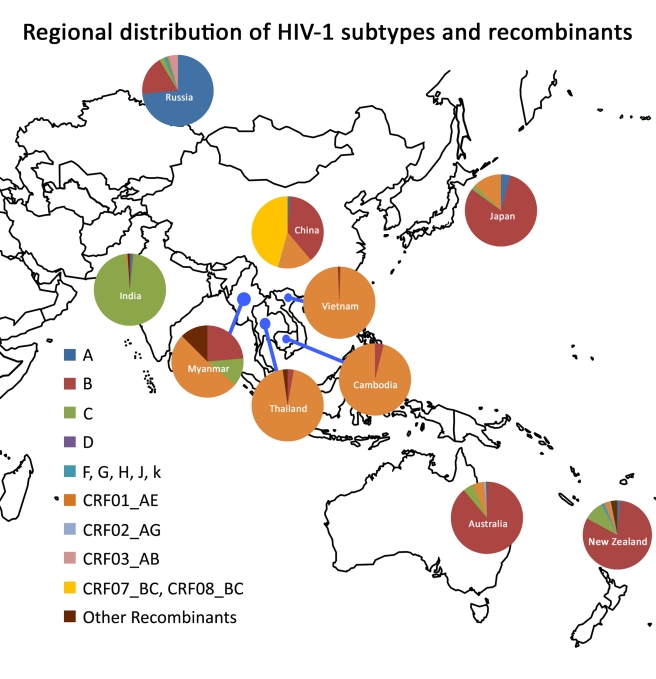
Figure 1. Regional distribution of HIV-1 subtypes and recombinants.
The relative proportion of each subtype/recombinant is shown in the pie chart for each country. The data on Figure 1 are from the former studies in the region and estimates made by AVAN Task Force members of the manuscript based on the unpublished data of their own research projects.

