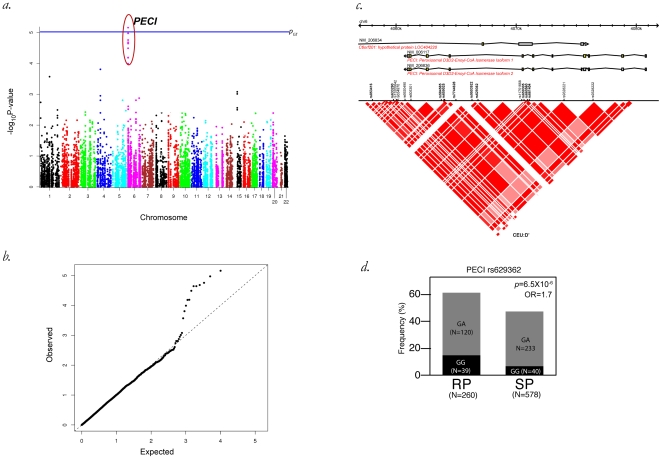
Figure 1. Association of SNPs within the PECI gene region of chromosome 6 with AIDS 1987.
A Manhattan plot (a.) and corresponding QQ plot (b.) for 10012 SNPs in NEMP genes showing the additive model that implicates SNPs in the PECI gene region exceeding the GT significance threshold (horizontal line, 9.2×10⁻⁶). A gene view of PECI showing SNPs tested and corresponding linkage disequilibrium as inferred by D' between SNPs (c.) and a bar-plot of genotypes of PECI versus the AIDS-1987 diagnosis in years past seroconversion (d.) are shown.

