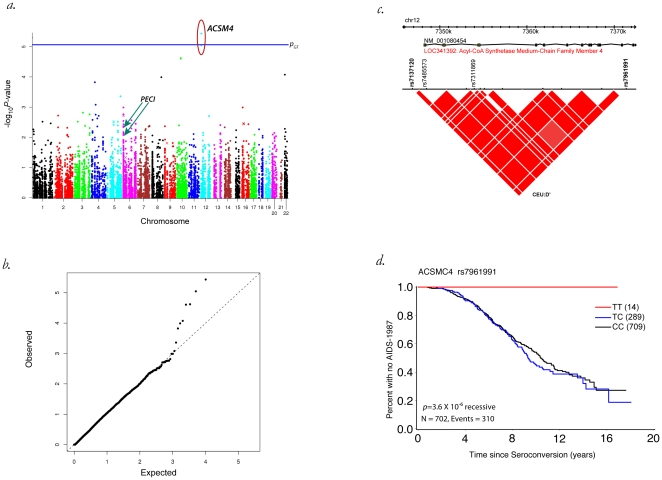
Figure 2. Association of SNPs within the ACSM4 gene region of chromosome 12 with AIDS 1987.
Shown as a a) Manhattan plot for time to AIDS-1987 (genetic model-recessive, GT significance threshold is shown as a horizontal line at 9.2×10⁻⁶), b) QQ plot, c) gene view of ACSM4 showing SNPs tested and corresponding linkage disequilibrium as inferred by D' between SNPs, and d) Kaplan-Meier plot of time to AIDS-1987 showing the three ACSM4 genotypes and the p-value for the recessive model.

