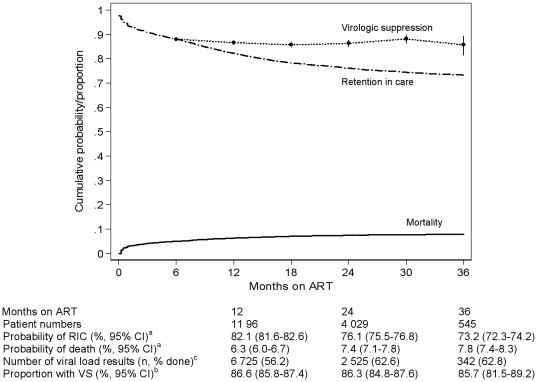
Figure 1. Kaplan-Meier estimates of death, retention-in-care; and proportions virologically suppressed adults according to duration of ART.
a Cumulative probabilities with Greenwood point-wise 95% confidence intervals. b Proportions with binomial exact 95% confidence intervals. c Proportion of patients eligible for viral load tests with a recorded database result. RIC, Remaining in care; VS, Virologic suppression (<400 copies/ml).

