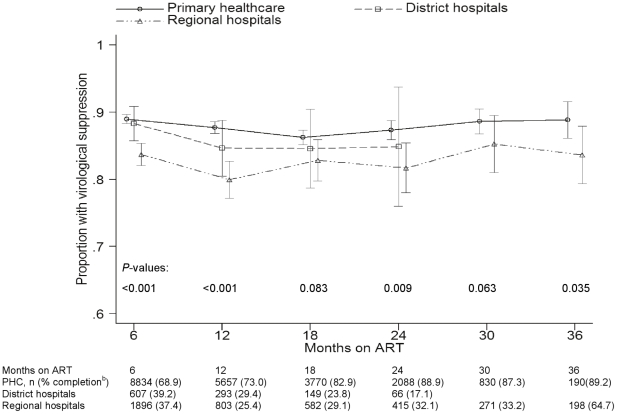
Figure 4. Proportions of patients with virological suppression at primary healthcare facilities and hospitals.a .
a Vertical bars indicate 95% binomial exact confidence intervals. b Proportion of patients eligible for viral load tests with a recorded database result. PHC-primary healthcare facilities.

