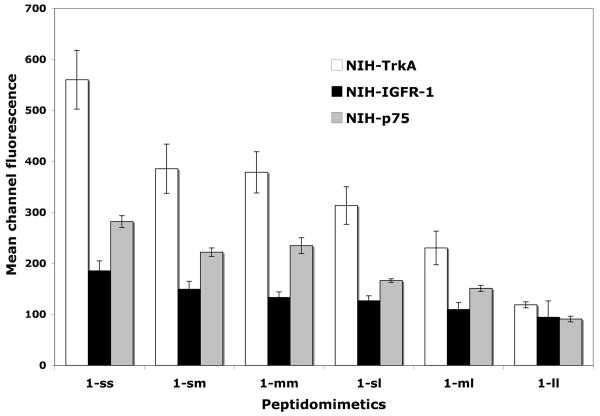
FIGURE 3. Direct binding FACScan assay with FITC-peptidomimetics.
Cells expressing the indicated receptor were bound with test ligand (20 μM) at 4°C. After washing, data was acquired and analyzed by FACScan/CellQuest with background subtracted. Mean channel fluorescence ± sem, n =3-6 independent experiments.

