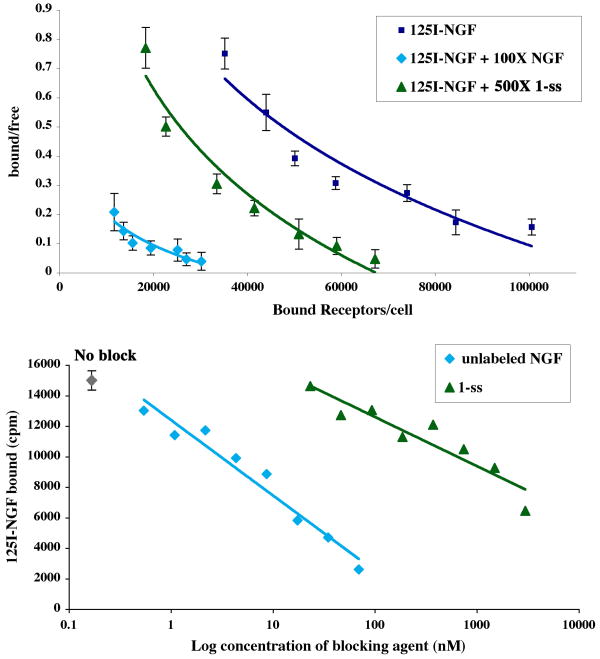
FIGURE 4. Inhibition of NGF binding to TrkA.
NIH-TrkA cells were studied. (A) Scatchard plot analysis of high affinity 125I[NGF] binding data. Binding assays were carried out using a range of 125I[NGF] and a 100-fold excess of unlabeled NGF or a 500-fold excess of mimetic 1-ss as inhibitors. (B) Displacement of a constant concentration of 125I[NGF] (∼15,000 cpms) by increasing doses of unlabeled NGF or by mimetic 1-ss. In all assays NIH-3T3 wild type cells were used to assess nonspecific background (<15% of total binding).

